Boosting Business Performance with KPI Scorecards
In the current digital milieu, the ability to oversee business performance and derive pertinent insights has conferred managers and C-level executives with a significant volume of data. This abundance not only enhances productivity but also facilitates cost reduction. Indeed, data has emerged as the cornerstone for all strategic decisions, and reporting software offers a platform to expeditiously and accurately respond to the generated information. This establishes the groundwork for the introduction of the KPI scorecard dashboard.
Measuring success with KPIs depending upon the business requirements and time frame a stakeholder selects while comparing the business values can be easily done with simple yet effective scorecards. Let's look at the definition, key differences with dashboards, and take a deep dive into the best practices to develop an efficient KPI scorecard for a robust roadmap for online data analysis.
KPI Scorecard: The Definition
A Key Performance Indicator (KPI) Scorecard is a strategic tool utilized in business management to assess and monitor the performance of an organization based on key metrics. It provides a comprehensive visual representation of critical performance indicators aligned with the company's strategic objectives.
The KPI Scorecard acts as a structured dashboard, presenting key data points and performance metrics in a clear and organized manner. This tool allows stakeholders, including executives and managers, to gain a holistic view of the business's performance, enabling data-driven decision-making. By measuring and tracking relevant KPIs, organizations can evaluate their progress, identify areas for improvement, and align their efforts with overarching business goals.
KPI Scorecard: Real-world Examples
Let’s look at some of the real-world examples of KPI Scorecard
Financial Health Scorecard
Purpose: Evaluate the financial stability and performance of a company.
- Revenue Growth: Percentage increase in revenue over a specific period
- Profit Margin: Ratio of net profit to total revenue
- Debt-to-Equity Ratio: Measures the proportion of debt used to finance the company
Impact
Guides financial decision-making, ensuring sustainable growth and risk management.
Customer Experience Scorecard
Purpose: Assess and enhance the overall customer experience.
Key Metrics
- Net Promoter Score (NPS): Measures customer loyalty and satisfaction
- Customer Satisfaction Index (CSI): Rates customer satisfaction on various touchpoints
- Customer Retention Rate: Percentage of customers retained over a specified period
Impact
Drives improvements in products, services, and customer support, fostering brand loyalty.
Sales Performance Scorecard
Purpose: Monitor and optimize sales team effectiveness.
Key Metrics
- Sales Conversion Rate: Percentage of leads converted into actual sales.
- Average Revenue per Customer (ARPU): Measures the average revenue generated per customer
- Sales Growth: Evaluates the percentage increase in sales over a defined period.
Impact
Guides sales strategies, identifies high-performing products, and enhances revenue generation.
Human Resources Productivity Scorecard
Purpose: Evaluate and improve workforce productivity and engagement.
Key Metrics
- Employee Engagement Score: Measures the overall satisfaction and engagement of employees
- Absenteeism Rate: Percentage of employees absent during a given period
- Training and Development ROI: Evaluates the return on investment in employee training
Impact
Informs talent management, guides training programs, and improves overall workplace satisfaction.
Supply Chain Efficiency Scorecard
Purpose: Optimize the efficiency and performance of the supply chain.
Key Metrics
- Order Fulfillment Cycle Time: Measures the time taken to fulfill customer orders
- Inventory Turnover: Evaluates how quickly inventory is sold or used
- Perfect Order Rate: Percentage of orders delivered on time and without errors
Impact
Enhances supply chain responsiveness, reduces costs, and ensures customer satisfaction.

KPI Scorecard: Benefits and Features
The Benefits & Features of KPI Scorecards are integral to enhancing organizational performance and strategic decision-making. Here are key aspects that make KPI Scorecards a valuable tool:
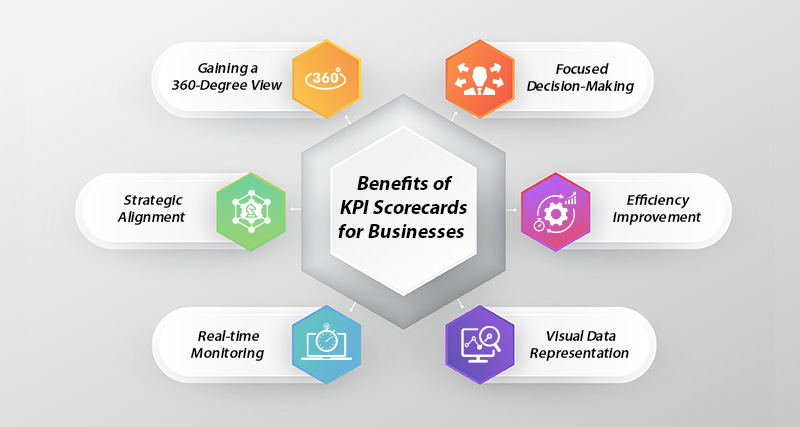
Gaining a 360-Degree View
The KPI Scorecard provides a holistic perspective on an organization's performance, offering insights across departments and functions. This comprehensive view enables stakeholders to identify strengths, weaknesses, opportunities, and threats, fostering a deeper understanding of the business landscape.
Strategic Alignment
One of the standout features of the KPI Scorecard is its ability to align organizational objectives with the overarching vision. By mapping KPIs to strategic goals, businesses can ensure that every action contributes to the larger mission, fostering cohesion and synergy within the company.
Real-time Monitoring
In the fast-paced business environment, real-time monitoring is non-negotiable. The KPI Scorecard excels in providing up-to-the-minute data, allowing organizations to adapt swiftly to changing circumstances. Real-time insights empower teams to make informed decisions promptly, giving them a competitive edge.
Focused Decision-Making
With a well-structured KPI Scorecard, decision-makers can concentrate on critical areas that require attention. This laser-focused approach ensures that resources are allocated efficiently, maximizing the impact of every decision made within the organization.
Efficiency Improvement
Identifying and addressing inefficiencies is a key benefit of the KPI Scorecard. By analyzing performance data, organizations can streamline processes, reduce bottlenecks, and enhance overall efficiency, leading to improved productivity and resource utilization.
Visual Data Representation
Visual representation of data is a forte of the KPI Scorecard. Infographics, charts, and graphs provide a user-friendly interface, making complex data easily digestible. This visual approach enhances communication and ensures that insights are accessible to stakeholders at all levels.
Common Performance Scorecard Mistakes and Their Solutions
Creating and implementing a Performance Scorecard is a powerful strategy for monitoring and improving organizational performance. However, certain common mistakes can undermine the effectiveness of these tools. Here are six common Performance Scorecard mistakes to avoid:
Overloading with Metrics
Pothole
Including an excessive number of metrics can overwhelm users and dilute the focus of the Scorecard.
Solution
Select a set of key metrics directly aligned with organizational objectives. Prioritize quality over quantity to maintain clarity and relevance.
Ignoring Data Quality
Pothole
Relying on inaccurate or outdated data compromises the integrity of the Scorecard.
Solution
Regularly audit and verify data sources to ensure accuracy. Implement data quality protocols to maintain the reliability of the information presented.
Lack of Alignment with Strategy
Pothole
Failing to align the Scorecard metrics with the overall strategic goals of the organization.
Solution
Ensure that every metric measured directly contributes to the overarching mission and objectives. Regularly review and adjust metrics to stay aligned with evolving business strategies.
Neglecting Adaptability
Pothole
Failing to adapt the Scorecard to changing business needs and environments.
Solution
Regularly review and update the Scorecard to reflect evolving priorities, industry trends, and organizational changes. An adaptable Scorecard remains a relevant and valuable tool.
Poor Visualization and Communication
Pothole
Ineffective communication and visualization of Scorecard data can hinder understanding and decision-making.
Solution
Design a visually intuitive layout with clear charts, graphs, and color coding. Ensure that the Scorecard is easily understandable by stakeholders at various levels of the organization.
Neglecting User Involvement
Pothole
Excluding key stakeholders from the development and review process can lead to a lack of ownership and engagement.
Solution
Involve relevant users and stakeholders in the design and review of the Scorecard. Solicit feedback and incorporate insights to ensure the Scorecard meets the needs of its intended audience.

Best Practices to Create an Efficient KPI Scorecard
Creating a KPI Scorecard is a strategic process that involves careful planning and consideration of organizational objectives. Here's a step-by-step guide on how to create an effective KPI Scorecard:
Step 1: Identify Key Objectives
Define the strategic objectives that your organization aims to achieve. These objectives serve as the foundation for selecting relevant Key Performance Indicators (KPIs). Ensure alignment with overall business goals.
Step 2: Select Appropriate KPIs
Choose KPIs that directly align with the identified objectives. These should be Specific, Measurable, Achievable, Relevant, and Time-bound (SMART). Consider input from relevant stakeholders and focus on metrics that truly reflect performance.
Step 3: Set Targets
Establish realistic and achievable targets for each selected KPI. Targets provide benchmarks for success and guide the ongoing evaluation of performance. Ensure that targets are aligned with the timeframe and scale of your business operations.
Step 4: Design Scorecard Layout
Create a visually intuitive layout for your KPI Scorecard. Group related KPIs together and use color coding for quick interpretation. The layout should be user-friendly, facilitating easy comprehension for stakeholders at various levels of the organization.
Step 5: Implement Data Collection Systems
Ensure the availability of accurate and timely data by implementing robust data collection systems. This may involve integrating existing software, utilizing analytics tools, or setting up data collection protocols. Reliable data is crucial for the credibility and effectiveness of the KPI Scorecard.
Step 6: Define Reporting Frequency
Establish a regular reporting frequency for the KPI Scorecard. Whether it's weekly, monthly, or quarterly, consistency in reporting helps in tracking progress over time. Regular reviews also enable timely intervention and adjustments.
Step 7: Incorporate Benchmarking
Consider incorporating benchmarking data to compare your organization's performance against industry standards or competitors. Benchmarking provides valuable context and helps identify areas where improvement is needed.
Conclusion
The use of KPI Scorecards is a game-changer in the pursuit of enhanced business performance. From strategic alignment to real-time monitoring, these tools provide a comprehensive and strategic approach to understanding and improving organizational effectiveness. Embrace the power of KPI Scorecards to propel your business toward sustained success. To know more about KPI scorecards and their implementations for your business, connect with us here.